


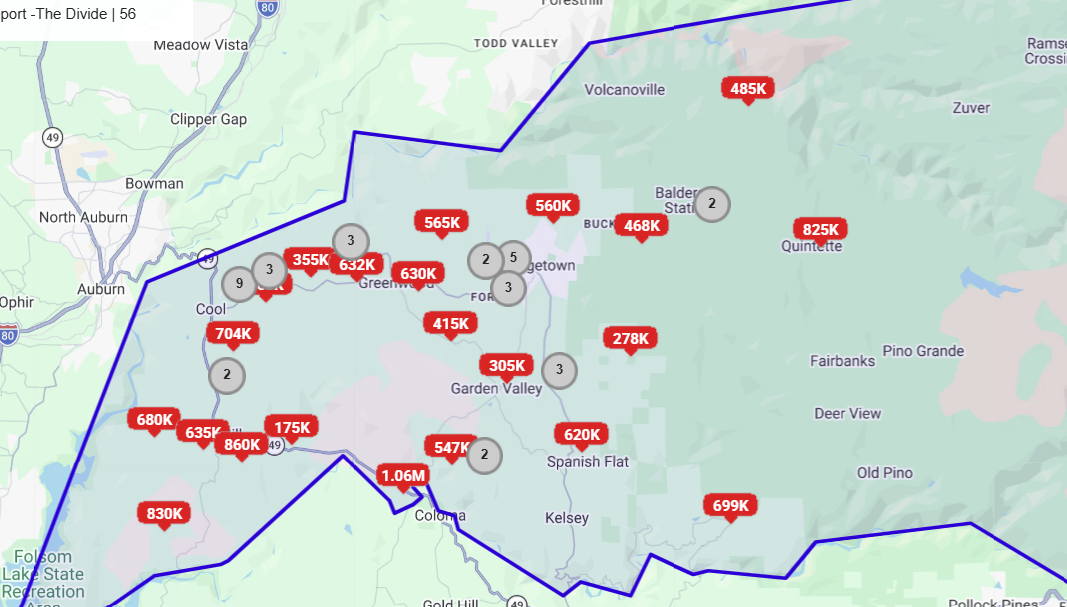
At first glance, the localized housing market across "The Divide" remains resilient, characterized by stable pricing structure and balanced inventory dynamics.
But when you pull back the layers of the onion, it really shows who's serious and who's just testing the market-
Let's look closely at the gap between wishful pricing and harsh transaction reality.
While the headline statistics show that homes are closing at 98% of their last list price, that figure only tells half the story. It completely hides two major groups of sellers currently operating on The Divide: the Market Testers who eventually walk away, and the Market Chasers who have to slash their prices drastically just to get into a position to negotiate that final 98%.
Here is what that underlying market dynamic looks like when you peel back the surface numbers.
Across this version of the Divide: Georgetown, Garden Valley, Greenwood, Kelsey, Cool, Pilot Hill Swansboro, Mosquito, Coloma, Lotus - current data reveals a healthy blend of steady transaction volumes and adaptive pricing, mirroring broader rural foothill market trends.
The following localized market analysis shows active listings, pending contracts, and closed escrow data the four months prior to up to October 30, 2026. It also shows the number of Cancelled and Expired listings at the same time, and highlights what some misled sellers have had to do in order to be successful.
The area between the forks of the American River, features an active inventory of 117 residential properties, 13 pending sales, 4 contingent entries, and 64 successfully closed transactions over the last four months. The median list price across all active residential property types sits firmly at $534,000, a balanced mid-point for buyers and sellers.
|
Market Status |
Listing Count |
Minimum Price |
Maximum Price |
Average Price |
Median Price |
Total Volume |
Average DOM |
|
Active Inventory |
117 |
$199,900 |
$5,900,000 |
$665,371 |
$550,000 |
$77,848,448 |
85 |
|
Contingent Contracts |
4 |
$395,000 |
$1,095,000 |
$650,000 |
$555,000 |
$2,600,000 |
58 |
|
Pending Escrows |
12 |
$199,000 |
$739,000 |
$482,100 |
$455,150 |
$5,785,200 |
71 |
|
Closed Sales |
66 |
$89,000 |
$1,265,000 |
$535,038 |
$493,000 |
$35,312,500 |
57 |
Macro-Level Demand & Time on Market Analysis
Days on Market (DOM) and Cumulative Days on Market (CDOM) serve as critical metrics for understanding buyer urgency and the sales velocity The Divide. The market currently displays two distinct speeds: properties priced competitively and accurately move quicker, with no price reductions. Properties not priced in that category are taking one or more price reductions and, of course, longer marketing times to sell.
A tracking breakdown of closed transaction velocities highlights a dominant rapid-absorption tier:
-
0 to 30 Days: 27 listings (42% of closed volume) successfully captured buyers rapidly, achieving a strong close-to-list ratio of 98.01%.
-
31 to 60 Days: 13 listings (20% of closed volume) found matches within their initial two months, yielding a 98.35% valuation retention.
-
61 to 90 Days: 11 listings (17% of closed volume) closed within this bracket, matching the 98% transaction standard.
-
91 to 120 Days: 7 listings experienced slight resistance, noticing a softening close-to-list yield down to 94.62%.
-
120+ Days: 6 stubborn listings required extended campaigns but ultimately stabilized, averaging a 97.06% close rate following adjustments.
Here's another way to look at it:
[64 CLOSED ESCROWS]
┌───────────────────┴──────────────────┐
▼ ▼
[NO PRICE DROPS] [PRICE DROPS REQUIRED]
• 45 Listings (70.3%) • 19 Listings (29.7%)
• Avg. DOM: 29 Days • Avg. DOM: 130 Days
• Avg. Closed to List : 1.5% • Avg. Drop to Sell: 11.2%
For the 45 homes that sold within 29 days, the original list price and the final list price are identical because they never did a price drop. And they sold for an astonishing 98.5% of their original asking price.
Because they didn't have to chase the market with price cuts, their final listed price was exactly what they started with. That means the entire negotiation—from their original starting point to the actual closed sale price—was just that minor 1.5% adjustment at the contract table.
A mere 1.5% adjustment means their original list price was incredibly accurate and right on the money.
To look at the two paths side-by-side using real dollar figures, here is how the math breaks down:
|
Pricing Metric |
Path A: Priced Right From Day One (45 Homes) |
Path B: Overpriced "Market Chasers" (19 Homes) |
|
Original MLS List Price |
$500,000 |
$500,000 |
|
Public MLS Price Drops |
None (0% Drop) |
$56,000 (11.2% Drop) |
|
Final MLS List Price |
$500,000 |
$444,000 |
|
Final Contract Negotiation |
$7,500 (1.5% Cut to Close) |
$8,880 (2.0% Cut to Close) |
|
Actual Closed Sale Price |
$492,500 |
$435,120 |
|
Average Time on Market |
29 Days |
130 Days |
For the 45 homes in that realistic tier, their original list price held firm all the way through until a buyer wrote an offer. They didn't lose their equity to price cuts, and they got their money out of the property (closed escrow) in most cases right around 2 months. (30 days to get an offer, open escrow, and be moved to pending status and then 30 days to close escrow).
So… in theory; group A and group B priced their homes at exactly the same price. $500k… only thing is only one group had a property worth $500k.
Now, here's the thing: there is an undeniable, HUGE difference between a $444k home and a $492K home in the same neighborhood. That is a big difference. Whether it's in location, quality, size, amenities or you name it. You are NEVER going to get the two confused.
That is… unless you are a seller with an agent who won't tell you the truth or you just don't want to hear it.
This statistical layout indicates that accurate upfront valuation positions a listing to capture active market energy within the first 30 days, shielding sellers from extended carrying costs and defensive list price erosion.
Canceled & Expired - the real picture of the market
To really see what is happening in the market, let's look at the entire section of homes again.
Let's look at properties that failed to sell. Over the tracked timeframe, 16 listings had listing agreements that Expired: They went through the entire listing agreement time period without selling. These properties carried an average list price of $503,112 had 163 days of market exposure without a successful offer.
During the same time, 30 listings were withdrawn from active status by their listing parties, shifting to a Canceled status. These canceled properties had a higher average listing target of $577,898 and for 107 average days on market prior to deletion. The combined total of 46 failed attempts underscores a clear market boundary: homes that are not priced right face consistent failure. So that means that of all the homes listed within this period, 64 sold and 46 failed. Over 40%.
BUT HERE'S THE REST OF THE STORY:
Canceled & Expired - The real picture of the market
To really see what is happening in the market, let's look at the entire section of homes again.
Let's look at properties that failed to sell. Over the tracked timeframe, 16 listings had listing agreements that Expired: They went through the entire listing agreement time period without selling. These properties carried an average list price of $503,112 had 163 days of market exposure without a successful offer.
During the same time, 30 listings were withdrawn from active status by their listing parties, shifting to a Canceled status. These canceled properties had a higher average listing target of $577,898 and for 107 average days on market prior to deletion. The combined total of 46 failed attempts underscores a clear market boundary: homes that are not priced right face consistent failure. So that means that of all the homes listed within this period, 64 sold and 46 failed. Over 40%.
That's a lot of wasted time.
And a lot of skewed real estate reports that never mention them.